
🔗 ShortlyAI
A production-grade URL shortener built as a Java 25 / Spring Boot 4 microservices platform with a built-in AI agent you can just talk to, and an MCP server so Claude can manage your links directly.
Most URL shortener projects are a single Spring Boot app with one table. This one is six independently deployable services with service discovery, circuit breakers, a full observability stack, an LLM-powered ReAct agent that can shorten, inspect, analyze, and delete your links through plain English, and a native MCP server so Claude Desktop can do the same - all spun up with a single
docker compose up.
⭐ If this saves you a weekend of wiring microservices together, a star helps a lot and tells me to keep building.















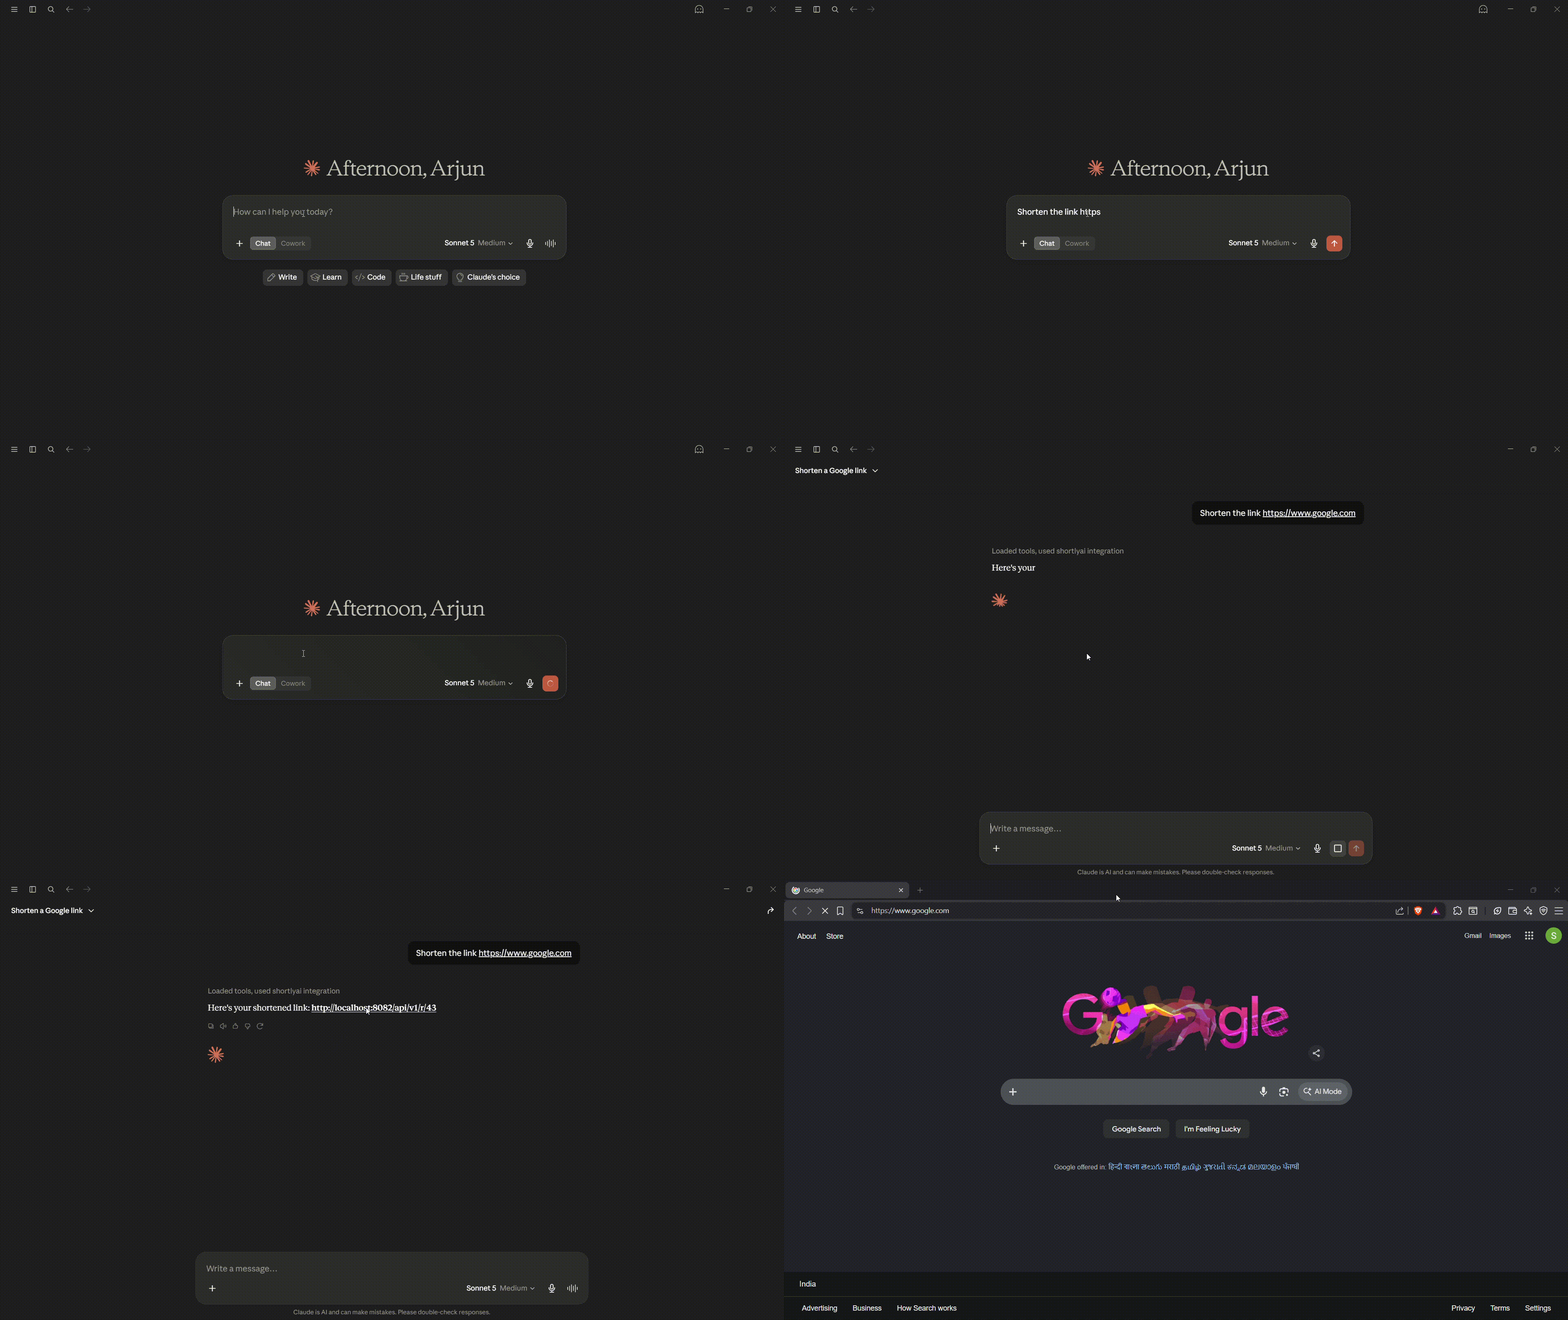
🎬 Demo
Claude AI MCP walkthrough
📑 Table of Contents
- Load Test Results
- Talk to Your Links (AI Agent)
- Use it from Claude Desktop (MCP)
- Architecture
- One Command, Full Stack
- API Docs (Swagger)
- Key Features
- Observability
- Resilience
- Tech Stack
- Services at a Glance
- Project Structure
- Project Status
- Engineering Highlights
- License
⚡ Load Test Results
Benchmark on the redirect hot path (GET /r/{slug}) cache-aside Redis, single local machine running all 15 Docker containers simultaneously. Tested with k6.
| VUs | RPS | Avg Latency | p95 | Errors |
|---|---|---|---|---|
| 50 | 342 | 20 ms | 48 ms | 0% |
| 100 | 681 | 19 ms | 44 ms | 0% |
| 200 | 1,332 | 24 ms | 62 ms | 0% |
| 500 | 1,576 | 163 ms | 383 ms | 0% |
| 700 | 1,259 | 346 ms | 817 ms | 0% |
284,485 total requests. 0 failures. 0 dropped connections.
The system peaks at ~1,576 req/s at 500 VUs then degrades gracefully. Latency climbs but the error rate stays flat at zero. That's backpressure working correctly (connection pool queuing), not a crash. At the realistic sweet spot of 200 concurrent users, the redirect path serves 1,332 req/s at 24 ms average latency, Redis cache-aside doing its job.
Numbers are from a single-instance, local-machine run with all 15 containers sharing one host. A dedicated Redis + Postgres deployment would push these significantly higher. The more interesting stat is zero errors under 700 VUs. The system slows, it doesn't break.
         /\      Grafana   /‾‾/
    /\  /  \     |\  __   /  /
   /  \/    \    | |/ /  /   ‾‾\
  /          \   |   (  |  (‾)  |
 / __________ \  |_|\_\  \_____/


     execution: local
        script: loadtest.js
        output: -

     scenarios: (100.00%) 1 scenario, 200 max VUs, 2m30s max duration (incl. graceful stop):
              * default: Up to 200 looping VUs for 2m0s over 3 stages (gracefulRampDown: 30s, gracefulStop: 30s)


  █ TOTAL RESULTS

    checks_total.......: 137017  1136.71665/s
    checks_succeeded...: 100.00% 137017 out of 137017
    checks_failed......: 0.00%   0 out of 137017

    ✓ status is 302

    HTTP
    http_req_duration..............: avg=26.92ms  min=0s       med=18.68ms p(90)=47.37ms  p(95)=65.68ms  p(99)=138.66ms max=1.39s
      { expected_response:true }...: avg=26.92ms  min=0s       med=18.68ms p(90)=47.37ms  p(95)=65.68ms  p(99)=138.66ms max=1.39s
    http_req_failed................: 0.00%  0 out of 137037
    http_reqs......................: 137037 1136.882573/s

    EXECUTION
    iteration_duration.............: avg=131.05ms min=102.29ms med=120.8ms p(90)=153.16ms p(95)=174.94ms p(99)=279.62ms max=1.51s
    iterations.....................: 137017 1136.71665/s
    vus............................: 5      min=3           max=200
    vus_max........................: 200    min=200         max=200

    NETWORK
    data_received..................: 46 MB  377 kB/s
    data_sent......................: 11 MB  92 kB/s
🤖 Talk to your links
ShortlyAI's standout feature is ai-service - a Spring AI ReAct agent that turns plain-English requests into real actions across the platform.
POST /api/v1/ai/agent
{
  "message": "Shorten https://www.github.com and tell me how many clicks it has so far"
}
{
  "reply": "The shortened URL for https://www.github.com is http://localhost:8082/G and it currently has 0 clicks."
}
Under the hood, the agent reasons step-by-step: it calls a shortenUrl tool against url-service, gets back a real urlId, then chains into getUrlStats against analytics-service, all without the LLM ever touching a database directly, and without the user ever knowing which microservice did what.
Try also:
- "What are my top 3 most clicked links?"
- "Delete the URL with slug ABC123, I confirm it"
- "Is this URL safe: http://verify-paypal-login.xyz"
Resilience built in: if url-service or analytics-service is down or slow, the agent doesn't crash. Resilience4j circuit breakers trip and the agent replies conversationally:
{
  "reply": "URL shortening is temporarily unavailable. Please try again in a moment."
}
🔌 Use it from Claude Desktop (MCP)
ai-service doubles as a native MCP server. Point Claude Desktop at it and manage your shortened URLs without leaving the chat window.
1. Generate an API key (one-time, via auth-service):
POST /api/v1/auth/apikeys
Authorization: Bearer <your JWT>
{ "name": "Claude Desktop" }
You'll get back a sk_... key - copy it immediately, it's shown exactly once.
2. Wire it into Claude Desktop's config:
{
  "mcpServers": {
    "shortlyai": {
      "command": "npx",
      "args": [
        "mcp-remote",
        "http://localhost:8080/mcp",
        "--header", "X-MCP-Key: sk_your_key_here"
      ]
    }
  }
}
On Windows, wrap the command as
"cmd"/["/c", "npx", ...].
3. Tools exposed to Claude:
| Tool | What it does |
|---|---|
mcp_shortenUrl |
Shorten a long URL, return the short link + numeric ID |
mcp_getUrlDetails |
Look up a URL's original destination + click count by slug |
mcp_deleteUrl |
Permanently delete a shortened URL (Claude confirms before calling) |
mcp_getUrlStats |
Click count for a specific URL by ID |
mcp_getTopUrls |
Your top-performing links by click count |
Auth is API-key based (SHA-256 hashed, validated against Redis on every call) rather than JWT. MCP connections are long-lived and tokens shouldn't expire mid-session. Every tool call is circuit-breaker protected against the same url-service/analytics-service dependencies the chat agent uses.
🏗️ Architecture
graph TB
    Client[("Client")]
    Eureka{{"eureka-server :8761<br/>Service Registry"}}
    Gateway["api-gateway :8080<br/>JWT • Rate limiting • Circuit breakers • Routing"]

    subgraph Services
        Auth["auth-service :8081<br/>JWT + OAuth2 + Refresh tokens"]
        Url["url-service :8082<br/>Shortening • Base62 • Redirects"]
        Analytics["analytics-service :8083<br/>Click tracking • Bloom filter"]
        AI["ai-service :8084<br/>ReAct agent • MCP server • Classification • Safety"]
    end

    PG1[("Postgres<br/>shortlyai_auth")]
    PG2[("Postgres<br/>shortlyai_urls")]
    PG3[("Postgres<br/>shortlyai_analytics")]
    RedisDB[("Redis 7<br/>cache • rate limit • bloom filter • API keys")]
    Kafka{{"Apache Kafka"}}
    Obs["Prometheus + Grafana<br/>metrics & dashboards"]
    MCP[("Claude Desktop<br/>via MCP")]

    Client --> Gateway
    MCP -. "X-MCP-Key" .-> AI

    Gateway -. discovers .-> Eureka
    Auth -. registers .-> Eureka
    Url -. registers .-> Eureka
    Analytics -. registers .-> Eureka
    AI -. registers .-> Eureka

    Gateway -- "circuit breaker" --> Auth
    Gateway -- "circuit breaker" --> Url
    Gateway -- "circuit breaker" --> Analytics
    Gateway -- "circuit breaker" --> AI

    Auth --> PG1
    Auth --> RedisDB

    Url --> PG2
    Url --> RedisDB
    Url -- "url.created / url.clicks / url.deleted" --> Kafka

    Kafka --> Analytics
    Analytics --> PG3
    Analytics --> RedisDB

    Kafka --> AI
    AI -- "url.classified" --> Kafka
    Kafka -.-> Url
    AI -- "circuit breaker + retry" --> Url
    AI -- "circuit breaker + retry" --> Analytics

    Auth -.->|/actuator/prometheus| Obs
    Url -.->|/actuator/prometheus| Obs
    Analytics -.->|/actuator/prometheus| Obs
    AI -.->|/actuator/prometheus| Obs
    Gateway -.->|/actuator/prometheus| Obs
Event flow example: shortening a URL triggers url.created → consumed by both analytics-service (initializes click counters) and ai-service (classifies the URL via LLM, generates a title, runs a safety check) → ai-service publishes url.classified → consumed back by url-service to persist the AI-generated title/category/safety flag. Fully async, fully decoupled - a real SAGA choreography, not a hardcoded call chain.
🚀 One command, full stack
git clone https://github.com/SNagarjuna07/shortlyai.git
cd shortlyai
cp .env.example .env
# fill in: DB credentials, Redis password, JWT secret, Groq API key, mail credentials

docker compose up -d --build
That's it 15 containers, fully wired:
| What | URL |
|---|---|
| API Gateway (entry point) | http://localhost:8080 |
| Swagger UI (all services, one page) | http://localhost:8080/swagger-ui.html |
| Eureka dashboard | http://localhost:8761 |
| Grafana (dashboards) | http://localhost:3000 (admin / admin) |
| Prometheus | http://localhost:9090 |
| Kafka UI | http://localhost:8090 |
All 6 services build from multi-stage Dockerfiles (eclipse-temurin:25-jdk → eclipse-temurin:25-jre), register with Eureka on startup, and expose /actuator/prometheus for metrics scraping out of the box.
Try it in 10 seconds once it's up:
# Register + login (or use OAuth2 Google)
curl -X POST http://localhost:8080/api/v1/auth/register \
  -H "Content-Type: application/json" \
  -d '{"email":"[email protected]","password":"your_password"}'

# Shorten a URL
curl -X POST http://localhost:8080/api/v1/urls \
  -H "Authorization: Bearer <your JWT>" \
  -H "Content-Type: application/json" \
  -d '{"originalUrl":"https://github.com/SNagarjuna07/shortlyai"}'

# Follow the redirect
curl -L http://localhost:8082/r/<slug>
📘 API Docs (Swagger / OpenAPI)
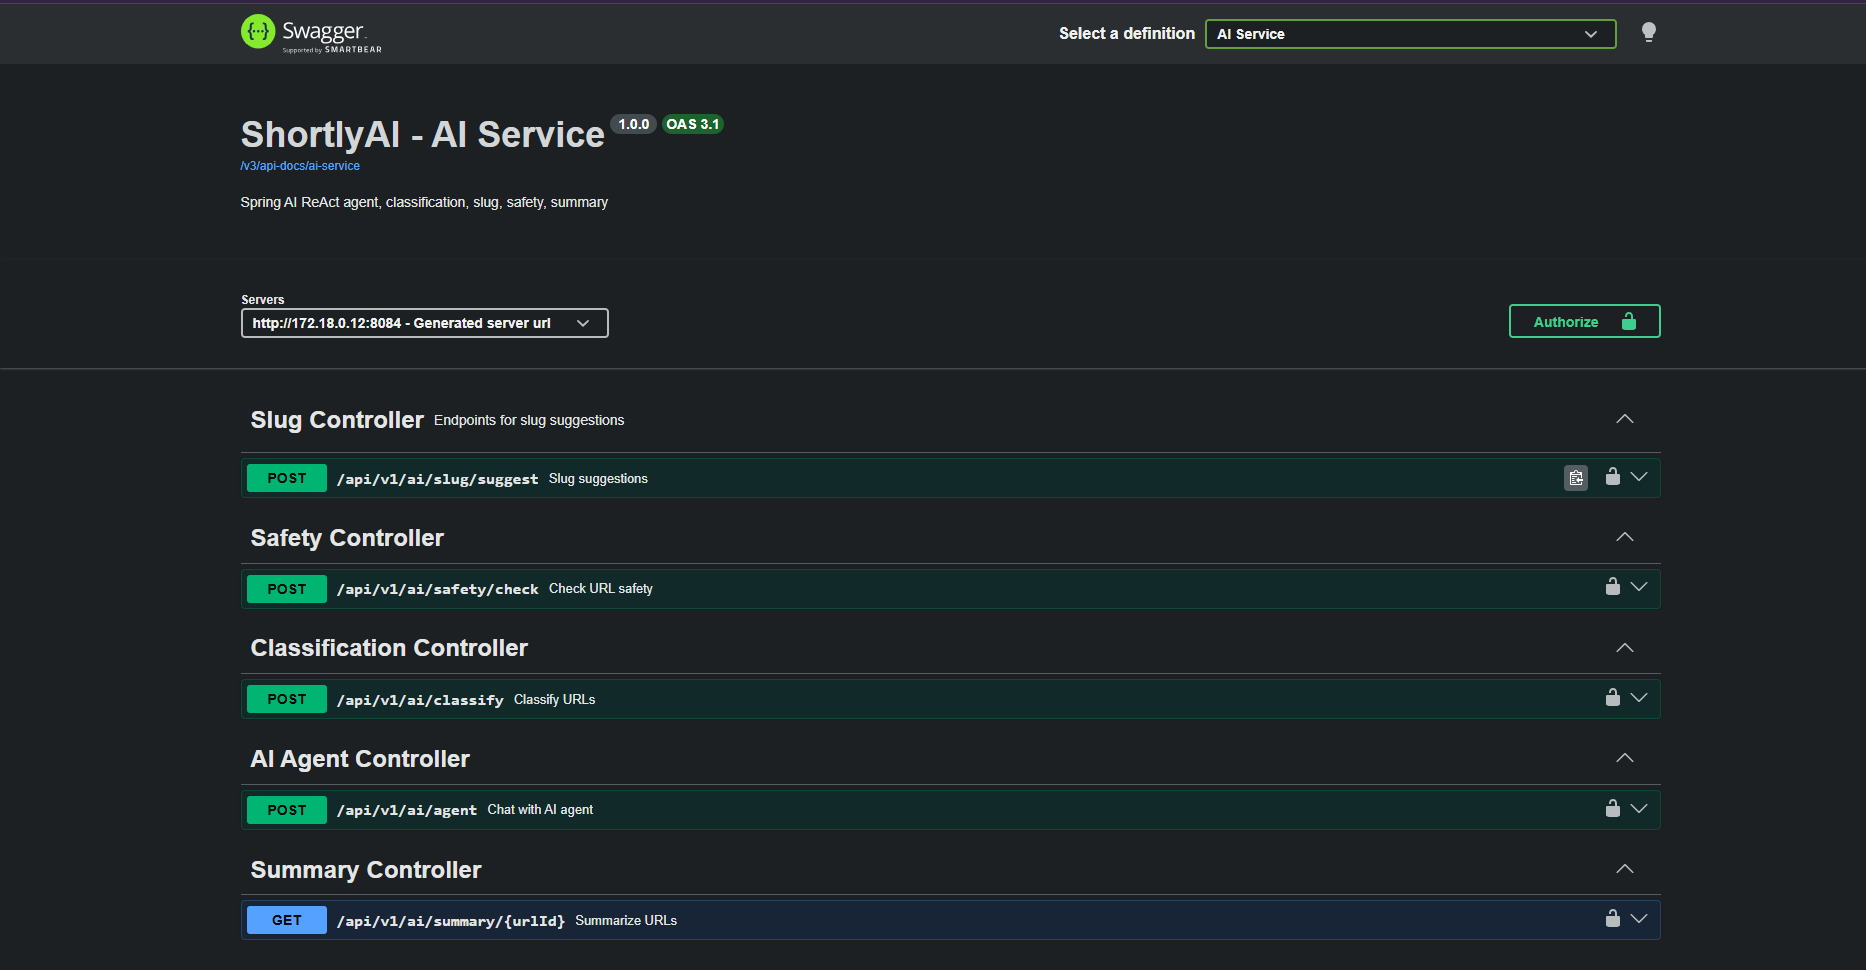
Every service ships full OpenAPI 3.1 docs via springdoc-openapi, aggregated into a single Swagger UI at the gateway:
| Service | Swagger UI |
|---|---|
| Gateway - aggregated, all services | http://localhost:8080/swagger-ui.html |
| Auth Service | http://localhost:8081/swagger-ui.html |
| URL Service | http://localhost:8082/swagger-ui.html |
| Analytics Service | http://localhost:8083/swagger-ui.html |
| AI Service | http://localhost:8084/swagger-ui.html |
✨ Key Features
| Category | What's implemented |
|---|---|
| AI / LLM | ReAct agent (Spring AI + tool calling), AI URL classification (title, category, safety), AI slug suggestions, AI-generated analytics summaries |
| MCP | Native MCP server (STREAMABLE transport) exposing URL/analytics tools to Claude Desktop, hashed API-key auth, circuit-breaker-protected tool calls |
| API Docs | OpenAPI 3.1 on every service via springdoc, aggregated single Swagger UI at the gateway |
| Auth & Security | JWT access/refresh tokens, OAuth2 Google login, BCrypt password hashing, email verification, audit logging, header-based service-to-service auth enforced independently on every service |
| URL Shortening | Base62 encoding, custom slugs, expiry dates, cache-aside Redis caching - 1,332 req/s at 24 ms avg p50 on a single instance |
| Analytics | Real-time click counters (Redis), hourly rollups, Bloom-filter click deduplication, per-user top-URLs leaderboard |
| Service Discovery | Netflix Eureka - all 5 business services self-register; gateway routes via lb:// for dynamic load balancing |
| Resilience | Resilience4j circuit breakers + retries on every cross-service call, with custom fallbacks; DLQ + scheduled retry for failed Kafka publishes |
| Distributed Jobs | ShedLock-coordinated scheduled jobs (expiry cleanup, cache warming, DLQ retry, token cleanup) - safe across multiple instances |
| Gateway | Spring Cloud Gateway (WebFlux) - central JWT validation, Redis token-bucket rate limiting, per-route circuit breakers, CORS, trace ID propagation |
| Observability | Custom Grafana dashboard, Prometheus metrics across all 6 services, structured JSON logging (Logback + Logstash encoder), MDC trace IDs |
| CI/CD | GitHub Actions pipeline - parallel per-service test jobs, image build & push to GHCR |
| Modern Java | Java 25, virtual threads, records for all DTOs/events, sealed types, text blocks for SQL/prompts |
📊 Observability
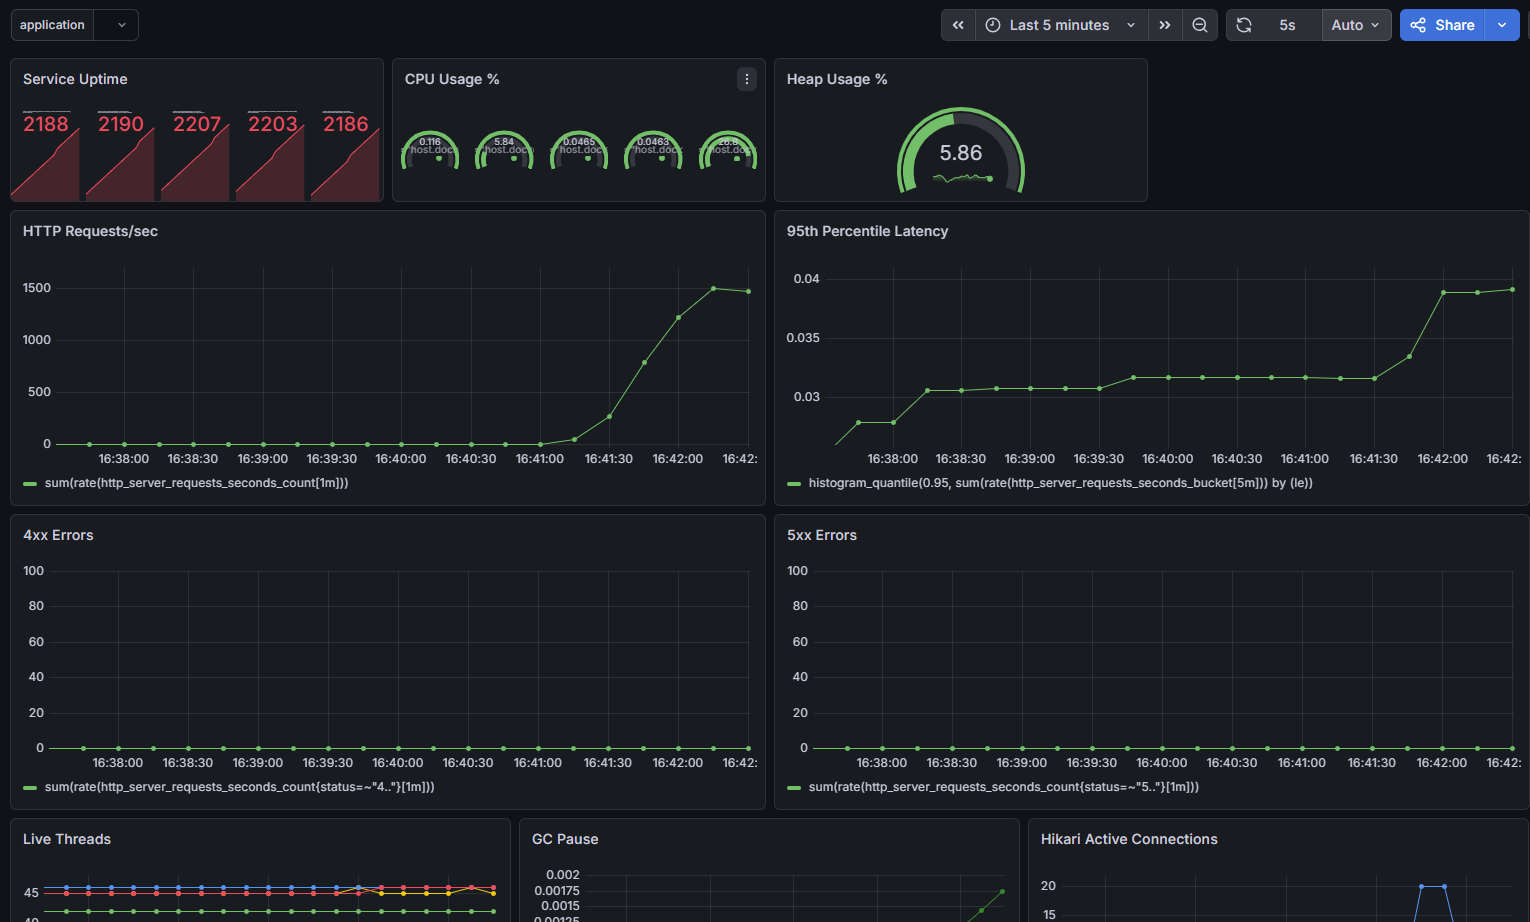
Every service exposes a /actuator/prometheus endpoint. The included Grafana dashboard is automatically provisioned with docker compose up and provides real-time monitoring of the entire microservices ecosystem.
The dashboard includes:
- HTTP request rate - requests processed per second across all services.
- 95th percentile latency (P95) - response time distribution under load.
- JVM heap usage - real-time heap memory utilization.
- CPU usage - CPU consumption for each service instance.
- Service uptime - application uptime for all running services.
- 4xx and 5xx error rates - client and server errors tracked independently.
- Live thread count - active JVM threads per service.
- GC pause time - garbage collection pause duration.
- HikariCP active connections - active database connection pool usage.
🛡️ Resilience
Two layers of circuit breakers, both Resilience4j, both Spring Boot 4 native:
ai-service→url-service/analytics-service-@CircuitBreaker+@Retry+@TimeLimiteronCompletableFuture-returning ops methods, backed by explicitreadTimeouton the underlying RestClient (shorter than the TimeLimiter window) so cancellation is real, not just cosmetic. 4xx responses pass through untouched; connection failures and 5xx trip the breaker and trigger a friendly fallback the agent relays in plain English.api-gateway→ all 4 downstream services - declarativeCircuitBreakerroute filters per service, with per-service-tuned thresholds (LLM-backedai-servicegets longer slow-call/timeout windows than CRUD services) and a dedicatedFallbackControllerreturning structured503JSON instead of hangs or raw stack traces.
🛠️ Tech Stack
| Layer | Technology |
|---|---|
| Language / Runtime | Java 25 (virtual threads enabled) |
| Framework | Spring Boot 4, Spring Cloud Gateway, Spring Security 7 |
| Service Discovery | Netflix Eureka (Spring Cloud) |
| AI | Spring AI 2.0.0-M6, ReAct tool-calling agent, MCP server, Groq |
| API Docs | springdoc-openapi 3 (OpenAPI 3.1, Swagger UI, gateway-aggregated) |
| Database | PostgreSQL 16 + Liquibase migrations |
| Cache / Rate Limiting | Redis 7 (RedisBloom module) |
| Messaging | Apache Kafka |
| Build | Maven (multi-module) |
| Containerization | Docker + Docker Compose (15-container stack) |
| Resilience | Resilience4j (resilience4j-spring-boot4, Spring Cloud Circuit Breaker), ShedLock |
| Logging | SLF4J + Logback + Logstash JSON encoder, Loki + Promtail |
| Metrics | Micrometer + Prometheus + Grafana |
| CI/CD | GitHub Actions, GHCR |
| Load Testing | k6 |
📡 Services at a Glance
| Service | Port | Responsibility |
|---|---|---|
eureka-server |
8761 | Service registry - all 5 services below register here |
api-gateway |
8080 | Single entry point - JWT validation, rate limiting, circuit breakers, routing, CORS, aggregated Swagger UI |
auth-service |
8081 | Registration, login, JWT/refresh tokens, OAuth2 Google, email verification, MCP API keys |
url-service |
8082 | URL shortening, Base62 slugs, redirects, cache-aside Redis, Kafka event publishing |
analytics-service |
8083 | Kafka consumer for click events, Bloom-filter dedup, real-time + hourly analytics |
ai-service |
8084 | ReAct agent, MCP server, AI URL classification, slug suggestions, safety checks, summaries |
📂 Project Structure
shortlyai/
├── docker-compose.yml       # full 15-container stack
├── prometheus.yml
├── promtail-config.yml
├── grafana/provisioning/    # auto-provisioned datasource + dashboard
├── eureka-server/
├── api-gateway/             # routing, auth, rate limiting, circuit breakers, Swagger aggregation
├── auth-service/            # JWT + OAuth2 + refresh tokens + MCP API keys
├── url-service/
│   └── src/main/java/com/shortlyai/url/
│       ├── shortening/      # Base62, core CRUD
│       ├── redirect/        # Public redirect endpoint
│       ├── expiry/          # Scheduled cleanup
│       ├── consumer/        # Consumes AI classification results
│       ├── dlq/             # Dead-letter-queue retry
│       └── events/          # Kafka event records
├── analytics-service/       # Click tracking, Bloom filter, rollups
└── ai-service/
    └── src/main/java/com/shortlyai/ai/
        ├── agent/           # ChatClient + @Tool methods (circuit-breaker protected)
        ├── mcp/             # MCP server tools + API key auth filter
        ├── classification/  # AI title/category/safety pipeline
        ├── slug/            # AI slug suggestions
        └── summary/         # AI-generated analytics summaries
Every service follows feature-based packaging - each feature folder contains its own controller, service, repository, and DTOs. No layer-based controllers/, services/, repositories/ folders.
🗺️ Project Status
-
eureka-server- service discovery for all 5 business services -
auth-service- JWT, OAuth2 Google, refresh tokens, audit logging, MCP API keys -
url-service- shortening, redirects, cache-aside, Kafka events, DLQ retry -
analytics-service- click tracking, Bloom filter dedup, hourly rollups, per-user leaderboard -
api-gateway- JWT validation, rate limiting, routing, CORS, circuit breakers, aggregated Swagger UI -
ai-service- ReAct agent, AI classification pipeline, slug/safety/summary endpoints - MCP server - tested end-to-end with Claude Desktop via
mcp-remote - OpenAPI / Swagger UI - every service, aggregated at the gateway
- Full Docker containerization - 15 containers, single
docker compose up - Observability - Prometheus + custom Grafana dashboard
- Resilience4j circuit breakers - gateway-level + AI-agent-level + MCP-level, with fallbacks
- CI pipeline - GitHub Actions, parallel per-service tests + GHCR image push
- Load tested - 1,576 req/s peak, 0 errors across 284k requests, single instance
🧠 Engineering Highlights
-
Event-driven SAGA choreography - URL creation triggers a chain of independent Kafka consumers (analytics initialization, AI classification, result persistence) with no central orchestrator. A real choreography pattern, not a distributed monolith.
-
TimeLimiter done correctly -
@TimeLimiterwrapsCompletableFuture-returning ops methods (the only way the aspect actually fires). The underlying RestClient has an explicitreadTimeoutshorter than the TimeLimiter window becauseCompletableFuture.cancel()per JDK Javadoc does not interrupt the running task. Without a real socket timeout, "cancellation" is cosmetic. Both layers are present. -
Cross-service contract discipline - every Kafka event and REST DTO is a Java record. Field-name mismatches across service boundaries are a real class of bug this project surfaced, debugged, and enforced against.
-
AI as tool-calling orchestrator, not a black box - the LLM never touches infrastructure directly. It calls typed
@Toolmethods that hit real microservices.ToolContext(chat agent) and aThreadLocal-scoped security context (MCP) keep user identity completely out of the LLM's input/output. -
Defense-in-depth auth - gateway validates JWTs once, but every downstream service independently validates the
X-User-Idheader it receives. No service is an open door even if reached directly, bypassing the gateway. -
Guaranteed delivery without a managed DLQ - failed Kafka publishes are persisted to a Postgres
failed_eventstable and retried on a ShedLock-coordinated schedule, surviving broker outages without requiring a managed Kafka cluster with DLQ topic support. -
Real load numbers - 284,485 requests at peak, 0 failures, benchmarked with k6. The redirect hot path sustains 1,332 req/s at 24 ms average latency on a single local instance under 200 concurrent users. Latency climbs under overload (500+ VUs) but error rate stays zero, graceful degradation, not collapse.
📄 License
MIT - see LICENSE
👤 Author
Built by S Nagarjuna as a portfolio project targeting production-grade microservices practices.
- LinkedIn: s-nagarjuna
⭐ Found this useful, interesting, or just well over-engineered for a URL shortener? Star the repo, it genuinely helps and costs you two seconds.
No comments yet
Be the first to share your take.