
Quant Garage
Trade like a pro. Without the terminal. View the full landing page →
Quant and equity research tools that run inside Claude, or behind your own UI. You ask Claude "preview NVDA earnings" or "screen for momentum names that pulled back this week" and you get back what a professional analyst would write at 6am, with the supporting numbers and citations to the API calls underneath.
Or you skip Claude entirely. pip install quant-garage and call the
same tool from your own code. Every skill is an importable Python
function that returns JSON, so it drops straight into a Jupyter
notebook, a research dashboard, a Slack alert, a cron job. Both paths
work because every skill ships the same compute as two layers: the
JSON contract for developers and a rendered note, table, stream, or
report for humans.
Forty-two primitives plus thirteen one-command workflows. One framework. Built in the garage, not the trading floor.
Needs a Massive API key. Free Basic tier runs twenty-one of the primitives plus most workflows end-to-end; $29/month Stocks Starter opens thirty-nine of the forty-two primitives and every workflow. One primitive (prediction-market-monitor) needs no Massive key at all — it uses Kalshi's public read-only API.
Feedback welcome. Found a bug or have an idea? Open an issue or send a pull request.
What the collection does
Each primitive is useful on its own. The point of having forty-two that share data, methodology, and audit trail is that they chain. The eight workflows show what that chaining looks like when someone wires the pieces together for a specific cadence.
Tuesday morning, you're long NVDA into Thursday's print.
earnings-drilldown shows the implied move is rich vs the 8-quarter
realized. valuation-sanity-check --mc puts the current price at the
78th percentile of peer-driven fair values. You like the setup but
want to size honestly. position-sizer puts NVDA at 8% under
vol-target given the 48% realized vol. You execute. portfolio-mark
walks the snapshot fallback chain; slippage-cost flags one fill that
crossed the spread. End of day: risk-report shows NVDA now drives
35% of portfolio variance.
One repo, one Massive key, one methodology.
The research side has the same shape. universe-builder screens for
momentum pullbacks; factor-research confirms which factors are
working this regime; news-scanner checks for catalysts on the
survivors; event-study measures the abnormal return around each
catalyst. You get from "what should I look at?" to "here's the regime
context and the abnormal-return distribution" in a single workflow.
Each tool plugs into the same quant_garage/ core: same client, same
timezone handling, same audit-trail format, same significance
thresholds.
The idea
Every number in this repo cites a live API call. Every take is computed from actual readings. Every peer set carries its sample size. When the data is thin, the tool says so instead of guessing.
That's the whole difference between a research tool and a chatbot with a market-data plugin. The tools refuse to fabricate when the data isn't there, and they surface the endpoint and timestamp for each figure so you can retrace the reasoning.
The methodology references inside each skill folder are where the IP lives: statistical methods, sample-size rules, base rates, edge cases, honest caveats about what the take does and doesn't prove. The Massive API provides the inputs. Everything else is workflow.
LLMs and agents work better on top of this surface than under it. Ask Claude Code "review my book" and it invokes the composite; ask any tool-use LLM and it consumes the same JSON. The dual layer means humans read a briefing, agents read a schema, both are anchored to the same live citation trail.
Who this is for
Four honest audiences.
Retail investors with a real book. $50K to a few million. You make informed decisions, you don't day-trade, you don't have a Bloomberg terminal, and you want sell-side-quality output on the positions you actually hold. The workflows above (portfolio-review, weekly-brief, preflight-trade) were built for this exact use pattern.
Fintech and market-data developers. You're building on top of Massive (or considering it) and you need reference tooling that shows what a serious integration looks like. Every skill is a working data layer with source-cited outputs, retry logic, and proper fallback chains. Fork it, adapt it, ship it.
LLM and agent developers. You're building finance-adjacent
agents that need tool-use with real citations, not fabricated
numbers. Every run() returns JSON matching a schema; every skill
is discoverable as a Claude Code skill under skills/. The dual-
layer contract is designed for exactly this use case.
Analysts and PMs, as supplementary tooling. You have Bloomberg or Factset. You don't need this to replace them. You do need it for the scriptable workflows the terminal is bad at: batch a watchlist scan, feed the output into a Slack channel, run a sanity check that's reproducible and citation-anchored.
Not for: people looking for a trading system. These tools encode analyst workflow, not strategy. The takes are pattern- matchers grounded in methodology; they aren't a signal engine. If you want production alpha, you build on top of this.
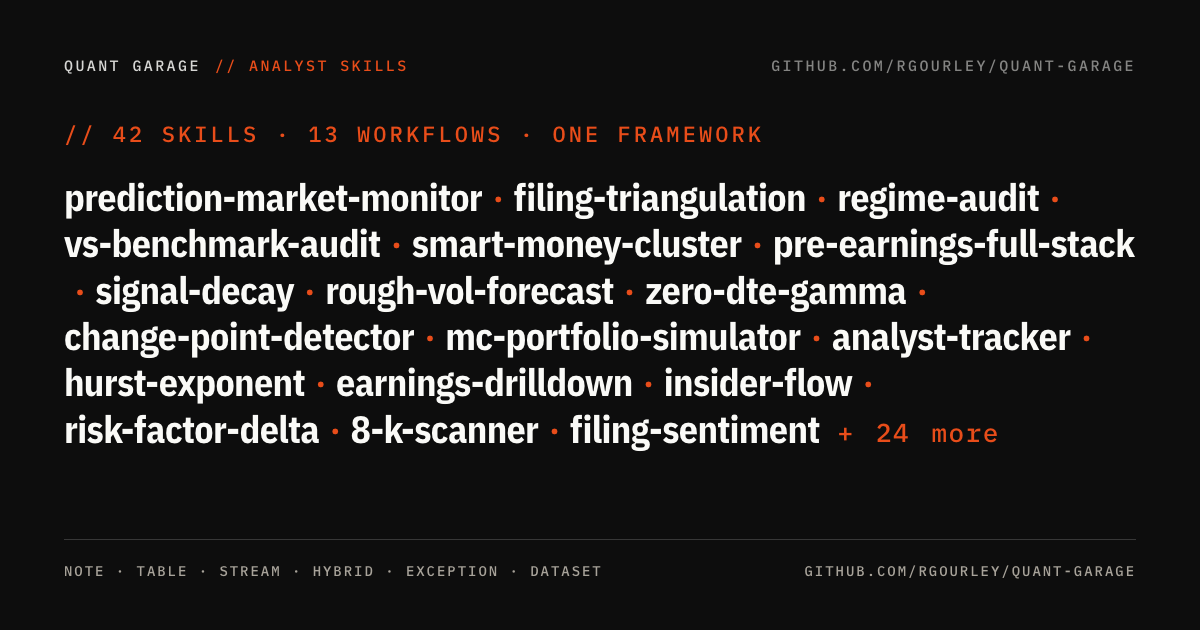
Thirteen one-command workflows
Start here. Workflows are chains of the 26 building-block tools below, wired for specific cadences. Each takes a watchlist or a ticker (or nothing, for macro-only reads) and returns a single briefing with a headline block up top and the full per-tool detail below. If you only try one thing in this repo, try one of these.
portfolio-review
The full book review in one call. Chains eight sub-skills: market-
regime, sector-rotation-signal, historical-analog-finder, risk-report,
earnings-blackout, macro-event-calendar, corporate-actions-scanner,
portfolio-rebalancer. Headline block distills each into one line:
regime, rotation theme, 90-day forward SPY distribution, portfolio
vol plus top variance contributor, next earnings, next macro, top
8-K, rebalance verdict. Built after a live review missed an ALLO
public offering (87.5M shares, 34% dilution) because the workflow
was run manually and one tool was skipped. Now the workflow is one
command that doesn't skip.
weekly-brief
Sunday-night prep. Watchlist-focused, not position-focused. market-
regime, sector-rotation-signal, macro-event-calendar (7-day window),
earnings-blackout (7-day window). The Sunday briefing that frames the
week: what's the tape, what's rotating, what prints, what macro
matters.
morning-brief
60-second daily open. market-regime, macro-event-calendar (today +
tomorrow), news-scanner (last N per watchlist ticker). Sharp
counterpart to weekly-brief: shorter horizon, news-focused. Cron
this at 8am for a briefing before you open the trading window.
preflight-trade
Before you hit execute. Takes a ticker plus intended action (buy,
sell, add, reduce, exit). Chains technical-briefing, earnings-
blackout (14d), news-scanner (last N), corporate-actions-scanner
(90d). Returns a deterministic verdict (go, wait, review) plus red
and green flag lists. Not a recommendation to trade or not trade.
A structured "is now obviously a bad time" gate.
earnings-week-prep
For weeks where four of your names print in five days. earnings-
blackout on the watchlist to find who prints, then earnings-drilldown
plus technical-briefing for the top-N imminent prints. The Sunday-
night briefing before a heavy earnings week.
historical-comparison
Twin decision-support. event-study on the specific event plus
historical-analog-finder on the market regime. Both anchors together
so you're not relying on one. Analog-only mode for when you don't
have a specific event to study.
scan-and-frame
Regime-framed idea generation. market-regime for context, universe-
builder for candidates, relative-strength to rank the top N. Optional
factor-research pass for factor context (heavy — off by default).
Discovery-mode, not position-mode.
stock-one-pager
Retail-tier single-name card. technical-briefing plus earnings-
blackout plus market-regime, translated into plain language. The
thing to read before you buy something you saw on social. Every
claim is gated to what the data actually says; nothing is templated.
Use cases, mapped to workflows
Concrete situations, mapped to the workflow that solves them.
| Situation | Workflow | Approx runtime |
|---|---|---|
| "It's Sunday evening. What's the setup for the week?" | weekly-brief |
~30s |
| "It's 8am. What's the tape doing and what happened overnight?" | morning-brief |
~15s |
| "I want to review my whole book, deep." | portfolio-review |
~90s |
| "I'm about to buy X. Is now obviously a bad time?" | preflight-trade |
~30s |
| "Four of my names print earnings this week. Prep them." | earnings-week-prep |
~2 min |
| "I have a directional view on X. How do I express it with options?" | options-structure-analyzer |
~15s |
| "What usually happens after market setups like this?" | historical-comparison |
~20s |
| "What sectors are actually rotating right now?" | sector-rotation-signal |
~10s |
| "My friend asked about a stock. Give me the plain-language read." | stock-one-pager |
~10s |
| "Screen for candidates in this regime." | scan-and-frame |
~30s (or ~90s with the factor pass) |
For the 42 individual primitives (compose your own workflow), scroll down.
The 46 building-block tools, with real use cases
The workflows above are chains of these. If you're building your
own workflow or agent, this is the shelf of primitives to compose
from. Each is a standalone run() -> dict with a rendered layer
for humans and a JSON layer for downstream code.
Earnings work
earnings-drilldown
You're long NVDA into Thursday's print. Trim, hold, or fade the
straddle? Run the tool. You get the implied move vs the 8-quarter
realized average, the post-earnings drift t-stat conditional on the
reaction direction, and which semis trade with NVDA on print days.
Output reads like a sell-side morning note: bold take at the top,
supporting numbers below.
event-study
You want to measure abnormal returns around any event class:
earnings, dividend changes, large volume spikes. Single event for
one ticker (gets you a note), the same event across many tickers
(cross-section table), or all events in a window (aggregate stats
with t-stats). Last month's run on mega-cap tech Q1 prints surfaced
that the cross-section average is negative despite all five beating
on EPS. Guidance is dominating headlines this regime.
earnings-blackout
You're running a watchlist and want a 30-second pre-trade hygiene
check: which names print this week, which printed yesterday, which
are clear. Run the tool. It returns each ticker bucketed into
blackout-imminent (0-3 days forward), blackout-soon (4-7),
just-printed (0-3 past), or clear, with the date, consensus EPS
where Benzinga is wired, and the 8-K item code where it falls back
to SEC EDGAR. Exception-report style: imminent blackouts on top,
clear names at the bottom.
Equity research and valuation
pitch-comps
You're a junior banker or an equity research analyst building a CRM
comp set. You need the software peer group with multiples, growth,
EBITDA margin, plus a regression-adjusted view that controls for the
growth differential. Run it, get a table you can drop straight into
the deck or the model. The one-sentence read at the bottom is the
take the MD or PM wants on page two.
valuation-sanity-check
The analyst on your team has a $250 NVDA target with assumed 28%
growth and 60% margin. Does it survive a peer-distribution sanity
check? The tool runs the reverse-DCF at the current price and tells
you what CAGR is actually priced in. When I ran it, the $250 target
came back understated against the semi peer set, which was the
opposite of what I expected. Pass --mc for the Monte Carlo
fan-of-outcomes mode: 10,000 samples across the peer growth × margin
× exit-multiple distribution, with the current price's percentile
within the resulting fair-value distribution and a per-driver
sensitivity ranking. More honest than a single point estimate.
position-sizer
You like the names — NVDA, AMZN, GOOGL, META all going in. How much
of each? Run the tool and get four canonical sizing methods side by
side: vol-target, fractional Kelly, risk parity, equal weight. The
methods usually disagree; that's the point. Vol-target cuts the
high-vol names so they don't dominate. Kelly tilts toward names with
the highest edge per variance (you supply the edges). Risk parity
equalizes each name's contribution to portfolio variance. Pick the
column whose worldview matches your conviction.
Quant research and screening
technical-briefing
You're staring at a single name and want the technical read before
you do anything else. Run the tool on NVDA. You get the composite
trend regime (bullish / bearish / neutral, strong or weak, with the
reasons that drove the label), RSI 14 with bucketed momentum read,
MACD line vs signal with cross status, SMAs 20 / 50 / 200, Bollinger
position, ATR as a percent of price, and the ADV-bucketed liquidity
context. Output is a sell-side morning-note block; the Take is
computed from the actual readings, not a hardcoded narrative.
universe-builder
You want every US common stock above $20 with quarterly +10% momentum
that pulled back this week. Run the screen. The tool walks the full
12,000-name universe, applies your filter chain, ranks the survivors
by composite z-score, and flags sector concentration. Last week's run
surfaced a trucking cluster (ARCB, RXO, SNDR, TFII, WERN, SAIA) all
off the same macro freight pullback. Real mean-reversion candidates.
factor-research
You want to know what factor is working in the current regime. Run
the tool on the S&P 500 over a 5-year window. You get the per-factor
IC at 1M/3M/6M/12M horizons, t-stats, decile long-short spreads, hit
rates, and the cross-factor correlation matrix. Quality at +3.1
t-stat is the only single factor with statistical significance right
now. Low-vol is negative across every horizon (recent regime rewards
risk-taking).
relative-strength
You have a basket of names and want to know which are leading and
which are bleeding vs SPY (or any benchmark) across 5 / 20 / 60 /
120-day windows. Run the tool. Each name gets RS in basis points per
window, a composite percentile rank within the basket, and a trend
label (stable_leader, improving, deteriorating, stable_laggard,
mixed). Pass --include-sectors to add the 11 SPDR sector ETFs into
the ranking and see whether NVDA's strength is the name or just XLK.
pairs-scanner
You have a sector basket and want to know which two names are
statistically tethered right now. Run the tool. Every pair gets an
Engle-Granger cointegration test on log prices, the ADF t-stat
bucketed against MacKinnon 2010 critical values, an
Ornstein-Uhlenbeck half-life of the spread, the current z-score, and
a 70/30 out-of-sample stability check that flags regime shifts.
Tradeable pairs surface at the top (widest spreads first); the
considered-but-rejected list shows why the others didn't make it.
Screen, not strategy.
hurst-exponent
Companion to pairs-scanner but single-name. Runs rescaled-range
(R/S) analysis on 2 years of daily log returns and reports the Hurst
exponent with a bootstrap confidence band. Classifies the name as
mean-reverting (H < 0.45), random walk (H in [0.45, 0.55]), or
trending (H > 0.55). Answers "is this name a mean-reversion setup or
a momentum setup?" Utilities and staples cluster on the low side,
growth names in strong runs on the high side.
change-point-detector
Bayesian Online Change-Point Detection (Adams & MacKay 2007) on a
ticker's daily log returns. Detects the specific dates where the
return-generating distribution shifted (regime change in mean, vol,
or both), reports posterior confidence at each boundary, and emits
per-segment annualized return + vol so you can see what changed.
Live on ALLO: the 2026-04-14 detection lands on the exact date of
the ALPHA3 trial futility announcement, confidence 0.9965. Not for
real-time entries (BOCPD lags real change points by 5-20
observations); use for post-hoc regime labeling and to audit
whether a pair's cointegration or a factor's edge broke partway
through the lookback.
signal-decay
Estimate the half-life of a candidate signal. Runs rolling 63-day IC
vs 5-day forward returns over a 5-year window, fits an exponential
decay to the IC series, and reports the half-life in trading days
plus a full performance tearsheet (deflated Sharpe, Sortino, Calmar,
ulcer, tail ratio, hit rate) on the signed-signal PnL. Motivated by
2024-25 factor decay research (Israel-Moskowitz-Ross,
Falck-Rej-Thesmar 2024, Chen-Zimmermann factor zoo). Live on SPY
mean-reversion: mean IC went from +0.06 early quarter to -0.16
recent quarter — the classic short-horizon mean-reversion effect
has completely flipped sign this cycle.
rough-vol-forecast
Rough-volatility-scaled vol forecast (Bayer-Friz-Gatheral 2016)
across multiple horizons. Under rough vol, realized vol scales as
h^H with H ~ 0.14 (Livieri et al. 2018 empirical) — much slower
than sqrt(t). Reports the rough-vol forecast alongside traditional
Brownian scaling and EWMA so you see the divergence directly. On
SPY: 120-day vol drops from 11.66% (traditional) to 2.08% (rough) —
a 5x reduction that changes how you size long-horizon scenarios.
Market context
prediction-market-monitor
Kalshi prediction market monitor for Fed decisions, CPI, GDP, NFP,
and other macro / market events. Motivated by 2025-26 post-election
growth of prediction markets as leading indicators. Reports the
implied probability at each strike, derives the cross-strike
probability distribution when the event is a laddered strike-type
(like KXFED-27APR-T4.25, T4.00, T3.75...), and computes the modal
outcome and expected value. Live on Kalshi Fed decisions: October
2027 shows 63.5% probability of a 25bp hike; December 2027 shows a
split market (37.5% hike vs 49% cut). Uses Kalshi's public
read-only API; no Massive key required.
market-regime
Daily macro briefing before you do anything else. SPY trend (above
or below 20/50/200-day MAs, 5 buckets from uptrend_strong to
downtrend_strong), VIX state with percentile rank vs trailing year,
breadth proxy from the 11 sector ETFs (how many above 50-day MA),
and 20-day RS leaders/laggards across sectors. Composite regime
label (risk_on, risk_off, mixed_risk_on, mixed_risk_off, neutral)
ships with explicit reasons so you see the evidence, not just the
label. Run it at the open; it's the right anchor for everything
else.
sector-rotation-signal
market-regime reports current sector leadership as a snapshot.
This one tells you how the leadership order has changed. Tracks 20-
day RS rank for the 11 SPDR sector ETFs across a rotation window
(default 30 days) and flags sectors that moved two or more positions
up or down. Categorizes moves into growth / value-cyclical /
defensive / rate-sensitive buckets and generates a plain-English
theme read. Last week's run flagged risk-off: XLU up seven ranks and
XLK down nine, defensives taking share from growth. Rank change is
the leading signal; absolute standings are already priced.
macro-event-calendar
Sibling to earnings-blackout. Forward calendar of the macro
releases that reprice the whole book: FOMC decisions, CPI, PPI, NFP,
ISM manufacturing and services, GDP, PCE, JOLTS, jobless claims,
retail sales. Every event ships with its expected release date, ET
release time, historical mean absolute one-day SPY move on that
release type, and impact tier. Crowded days (two-plus events on the
same date) get their own callout. FOMC dates are hardcoded from the
official schedule; recurring events are pattern-derived and flagged
as such so you can verify against the official calendar before
sizing around a print.
historical-analog-finder
market-regime tells you today's state. This one takes that state
and finds K historical periods with the most similar setup, then
reports the forward SPY return distribution across those analogs.
Features are SPY-only (5/20/60/120-day return, above 50 and 200-day,
RSI 14, realized vol, drawdown from 252-day high) with z-scored
Euclidean distance. Deduplicates overlapping matches so one
historical window can't dominate the K. The mean is not a forecast;
the interquartile range is the honest read. Last run: 20 nearest
analogs to the current tape gave a 75% hit-rate above zero at 60 and
252 days, median +14.3% at 252d, with mid-2024 and late-2021 pulling
opposite directions in the K set.
single-name-vs-sector
relative-strength ranks a name versus SPY, which conflates two
things: is the name strong because its sector is strong, or is it
pulling away from its own sector. This one splits them. Three RS
legs across 5/20/60/120-day windows: name vs sector, sector vs
benchmark, name vs benchmark. Classifies the name as leading,
lagging, or diverging (name and sector pointing opposite ways).
Surfaced when SOFI showed as a stable laggard at -4100bp vs SPY 120d
while XLF was leading at +377bp 20d. The weakness was name-specific,
not a financials problem. Divergence takes precedence over sign, so
the tool catches the important case first.
commodity-cycle
Is this commodity in a winning or losing macro setup, and which
driver dominates. Rolling correlations against the dollar (UUP), the
real-yield proxy (TIP minus IEF), and (for gold) miner divergence
vs GDX and silver co-movement. Plus a momentum quintile ranked
against the trailing year. Reads constructive, neutral, or headwind
with the dominant variable named. On GLD 60d: headwind, dominant
driver a strong dollar (60d corr -0.68) plus rising real yields,
miners lagging -9%, momentum in the bottom quintile. Would have
flagged the gold drawdown before price confirmed.
Trading and execution
options-flow
You're scanning a watchlist for unusual options activity. Premium
size, volume vs open interest, above-ask vs below-bid, repeat-strike
clustering. Output is a tight stream of the top 10-20 prints with a
sentiment tag per block. Yesterday's run surfaced a TSLA bullish read
where someone sold $400 puts on the bid AND bought $385 calls above
the ask. Two trades, same direction.
zero-dte-gamma
Estimate net dealer gamma exposure (GEX) for same-day-expiry SPY /
SPX / QQQ / IWM options and identify gamma pins. Motivated by
2024-25 research (Baltussen-Terhorst-Van Vliet 2024, Bhattacharya
2024) documenting that 0DTE options now drive systematic intraday
moves through market-maker delta hedging pressure. Reports net
dealer gamma, gamma regime (long/short), gamma flip strike, and top
5 pins with per-side call and put notional. Live on SPY 2026-07-13
expiry: $754.95 spot, dealers net short $1.25B gamma at the top
pins concentrated at $759 call strikes (9,412 OI) — expect
intraday moves to accelerate rather than mean-revert.
news-scanner
You want today's notable news cross-referenced against the price
reaction and sentiment. Each event ships with sentiment score,
novelty score (is this a re-run or a new angle), and a price-vs-
sentiment divergence flag. A "positive" article that the stock sold
off on means the market already knew; that's a flag worth surfacing.
slippage-cost
You hand the tool yesterday's executed fills. It pulls the microsecond
NBBO at each trade time, computes slippage vs the inside, and flags
fills that crossed the spread, printed off-NBBO, hit a wide spread
moment, or showed adverse selection in the 30 seconds after fill.
Measures fill vs NBBO at fill time, not arrival-price Implementation
Shortfall. The exception report is short by design: only the broken
stuff surfaces.
options-structure-analyzer
You have a view but no structure yet. Tell the tool your thesis
(direction bullish, direction bearish, vol long, vol short, or
hedge), your horizon, and your target move. It enumerates the
candidate options structures (long call or put, bull or bear spread,
straddle, strangle, iron condor, protective put, collar), pulls the
nearest expiry with priceable legs on both sides, computes each
structure's payoff at your target, and ranks by payoff-to-capital.
Not a recommendation. A structured comparison so you can pick the
structure whose tradeoffs match your view, not just the one your
platform happened to surface. On hedges, it reports the P&L improvement
vs unhedged rather than a meaningless "percent of net premium" ratio.
hedge-suggester
risk-report flags positions carrying most of the book's variance.
options-flow shows what other traders are doing. Neither proposes
what to do about a concentrated long. This one takes one long
position and returns five priced option overlays (covered call,
protective put, collar, put spread, ratio put spread) from the live
chain, ranked by cost per dollar of downside protected. IV context
from ATM implied vs 20-day realized volatility as a variance-risk-
premium proxy, labelled expensive, fair, or cheap. Take fitted to
the stated risk tolerance. On an ALLO 90-day run: collar priced as
a net credit at -1.4% of notional, IV at 1.76x realized (expensive),
tail-risk flag on the ratio structure. Not investment advice.
Risk and operations
portfolio-mark
You need end-of-day marks for a position book. Run the tool. It pulls
the snapshot per name, walks the fallback chain (last trade → snapshot
last → minute close → day close → prior close), reports per-position
confidence (high/medium/low), and flags any name where the mark looks
stale or the spread is wide enough to need a manual check. Two modes:
delayed REST for end-of-day reports, live WebSocket for intraday.
risk-report
The book is already marked. Now what could happen to it? Run the tool
and get VaR + Expected Shortfall at 95/99, max drawdown over the
lookback window with peak/trough dates, the five worst historical
days with per-name loss attribution, every position's share of the
variance budget, and a Herfindahl-based concentration read. Pairs
with portfolio-mark: marks tell you what the book is worth right
now; this skill tells you what could happen to that value. Pass
--mc for path-VaR: 10,000 correlated return paths simulated from
the fitted covariance matrix, with normal or student-t innovations
for fatter tails, over a configurable horizon. Emits cumulative
return percentiles, path max-drawdown distribution, and P(loss > X%)
at 5/10/20% thresholds.
mc-portfolio-simulator
Standalone Monte Carlo forward P&L simulator. Give it a book and a
horizon; get back the distribution of outcomes, tail scenarios, path
max-drawdown, and probability of loss / gain at 5/10/20/30%
thresholds. Uses the same covariance-matrix pipeline as
position-sizer and risk-report --mc, so results are directly
comparable across the three tools. Answers "given my proposed
weights, what's the 5th percentile 60-day portfolio outcome?"
portfolio-macro-scenario
risk-report and portfolio-review are descriptive of the past.
This one is prescriptive under a scenario you name. Per-position OLS
regression on TLT/UUP/USO/GLD daily returns, applies rates, dollar,
oil, and gold shocks, aggregates to book P&L with a rough +/-1.64
sigma band. Ranks positions by absolute P&L contribution and factors
by aggregate contribution. Rate shocks convert to a TLT return via
an assumed effective duration of 17 years. On a 12-position book
with +50bp / +2% dollar / +10% oil / -5% gold: book P&L -$17,130
(-3.9%), gold factor 40% of the loss, TLT factor 33%. Betas are
historical and unstable, factors are collinear (rates, dollar, oil,
gold co-move), and the CI band assumes residual independence, all
noted in the caveats.
portfolio-rebalancer
risk-report tells you which name is driving the risk. This skill
tells you what to do about it. Feed it the same weights + book
value; set a variance-share cap, weight cap, and churn cap; it
returns a specific rebalance ticket list: which names to trim, which
to add, exact dollar amounts, before-and-after weight, before-and-
after variance share. Iterative solver with a proportional
redistribution rule so one name's trim doesn't over-concentrate the
next name. Refuses to churn more than the preset per rebalance so a
single call cannot blow up a portfolio. Not tax-aware, not
liquidity-aware, honest about both in the caveats. Turns "ALLO
carries 66 percent of variance" into "sell $66k of ALLO, redistribute,
portfolio vol drops from 21 to 15 percent."
corporate-actions-scanner
Different job from corp-actions-reconciler. The reconciler checks
whether your position file has the correct post-split share count.
This one scans forward-looking: for a ticker or watchlist, it pulls
SEC 8-K filings over a lookback window (default 180 days), filters
to material items (offerings, private placements, splits, spin-offs,
buybacks, M&A, restatements), cross-references Massive news for the
headline, and computes the T+1 and T+5 price reactions. Built after
a portfolio review missed an ALLO public offering (87.5 million
shares at $2, 34 percent dilution) because news-scanner defaulted to
a 24-hour window. The offering was 78 days old and dominating the
current price, and no dedicated tool surfaced it.
corp-actions-reconciler
An ops desk inherits a position file from 2024. Did the share counts
get adjusted for AAPL's 4-for-1 split? GOOGL's 20-for-1? NVDA's 10-
for-1? Run the tool. The exception report lists every position whose
recorded share count doesn't match the expected post-split share count,
with the source endpoint and verified-at timestamp on every flag.
t+1-settlement-prep
You're an ops manager looking at tonight's trades. Which ones have
settlement risk crossing this weekend? Which ones need a short-sale
locate confirmed before tomorrow's cutoff? Which ones cross an ex-
dividend date? The tool walks each trade against the US holiday and
corporate-action calendar and flags six failure modes, with a
suggested next action per flag.
Filings and ownership
8-k-scanner
You have a watchlist. What material events hit those names this week?
Run the tool. It pulls every 8-K disclosure across the basket, groups
the tagged Items by filing, ranks by signal bucket (M&A / Strategic
above Restatement above Material agreement above Regulatory above
Leadership change above Capital above Earnings above Corporate
housekeeping), and puts the highest-signal filings at the top with
the supporting text quoted. Last live run caught RKLB's Iridium
merger agreement, NVDA's Ajay Puri retirement + Nicholas Parker hire
package, MSFT's Reid Hoffman board departure, ALLO's CEO succession,
and NVDA's $11B notes issuance. One 45-day scan across 6 mega caps.
risk-factor-delta
Did management add anything new to Item 1A this year? Run the tool.
It diffs the last two 10-K risk-factor disclosures using Massive's
pre-parsed three-tier taxonomy (primary/secondary/tertiary category
per risk). Reports categories added, categories dropped, and
categories where the supporting text materially changed (>= 25%
length shift). Live run on AAPL's 2024 vs 2023 10-K surfaced 13 new
risk categories concentrated in technology_and_information (AI risk,
third-party data security, tech-vendor dependence), plus new
trade/tariff and credit risk categories. Also caught 7 retained
categories where AAPL trimmed language (pricing pressure -46%,
IP -42%, ESG -39%): a defensive language shift the sentiment
scorer independently confirmed.
filing-sentiment
Score the Business and Risk Factors sections of a company's last two
10-Ks using the Loughran-McDonald finance dictionary. Reports rate
per 10,000 tokens by category (negative, uncertain, litigious,
constraining, modal-weak, modal-strong) prior vs current with a
shift label. Answers "did management's language get more defensive?"
Live run on AAPL showed negative language up 33% in the Business
section and modal-strong ("must", "will", "always") language down
38% in Risk Factors: management getting less assertive and more
hedged. Pair with risk-factor-delta for the structural view; this
handles the tone.
insider-flow
Are insiders buying or selling this name? Run the tool. It pulls
every Form 4 for the ticker over the lookback window, classifies
each transaction (conviction buy P, discretionary sale S,
scheduled 10b5-1 sale, routine comp A/M/F, non-informative),
filters 10b5-1 out of sentiment, detects cluster buys (>= 2
insiders in a 14-day window worth >= $100k), and emits a bullish/
bearish label backed by net conviction dollar flow. --exclude- directors cuts out VC/PE board reps unwinding fund positions
(which structurally look bearish but carry no operator signal).
Live run on RKLB showed a $27M director sale from a VC rep that,
once excluded, still left the general counsel and president as
net sellers.
manager-portfolio-diff
What did Buffett/Klarman/Burry do last quarter? Run the tool with
an alias (--filer berkshire) or a CIK. It pulls the two most
recent 13-F snapshots for the fund, aggregates by CUSIP across
joint filings, and reports initiations, exits, adds (>= 25% share
change), trims (<= -25%), and portfolio value delta. Live run on
Berkshire caught Buffett exiting Visa, Mastercard, UNH, Dominos in
Q1 2026 while adding Alphabet +204% and initiating Delta Air Lines
at $2.65B. Alias set: berkshire, baupost, renaissance, bridgewater,
third-point, pershing, tiger-global, scion, appaloosa.
guidance-tracker
Has management been raising or cutting guidance this cycle? Run the
tool. Uses Benzinga Corporate Guidance to compare each event's
midpoint against the prior figure for the same fiscal period,
labels as raised / lowered / reaffirmed / initiation, groups by
fiscal period, and reports trajectory. Requires the Benzinga
Corporate Guidance add-on (approx $99/month); the skill emits a
clean NOT_AUTHORIZED caveat when the entitlement is missing.
analyst-tracker
Track sell-side positioning on a name. Uses Benzinga analyst ratings
to pull every rating event over the lookback window, classifies each
as upgrade / downgrade / initiation / reiteration / PT-change /
drop-coverage, aggregates the latest per firm, and reports the
consensus median price target plus buy/hold/sell distribution. This
is the sell-side lens pair with insider-flow (internal vs external
sentiment on the same name). Live NVDA run over 180 days: 26 firms
all Buy, consensus PT $308.50, big
No comments yet
Be the first to share your take.