
Lookspan
Local-first observability dashboard for AI agents. MCP-native. See every span your agents emit.





npx lookspan # → http://127.0.0.1:3100
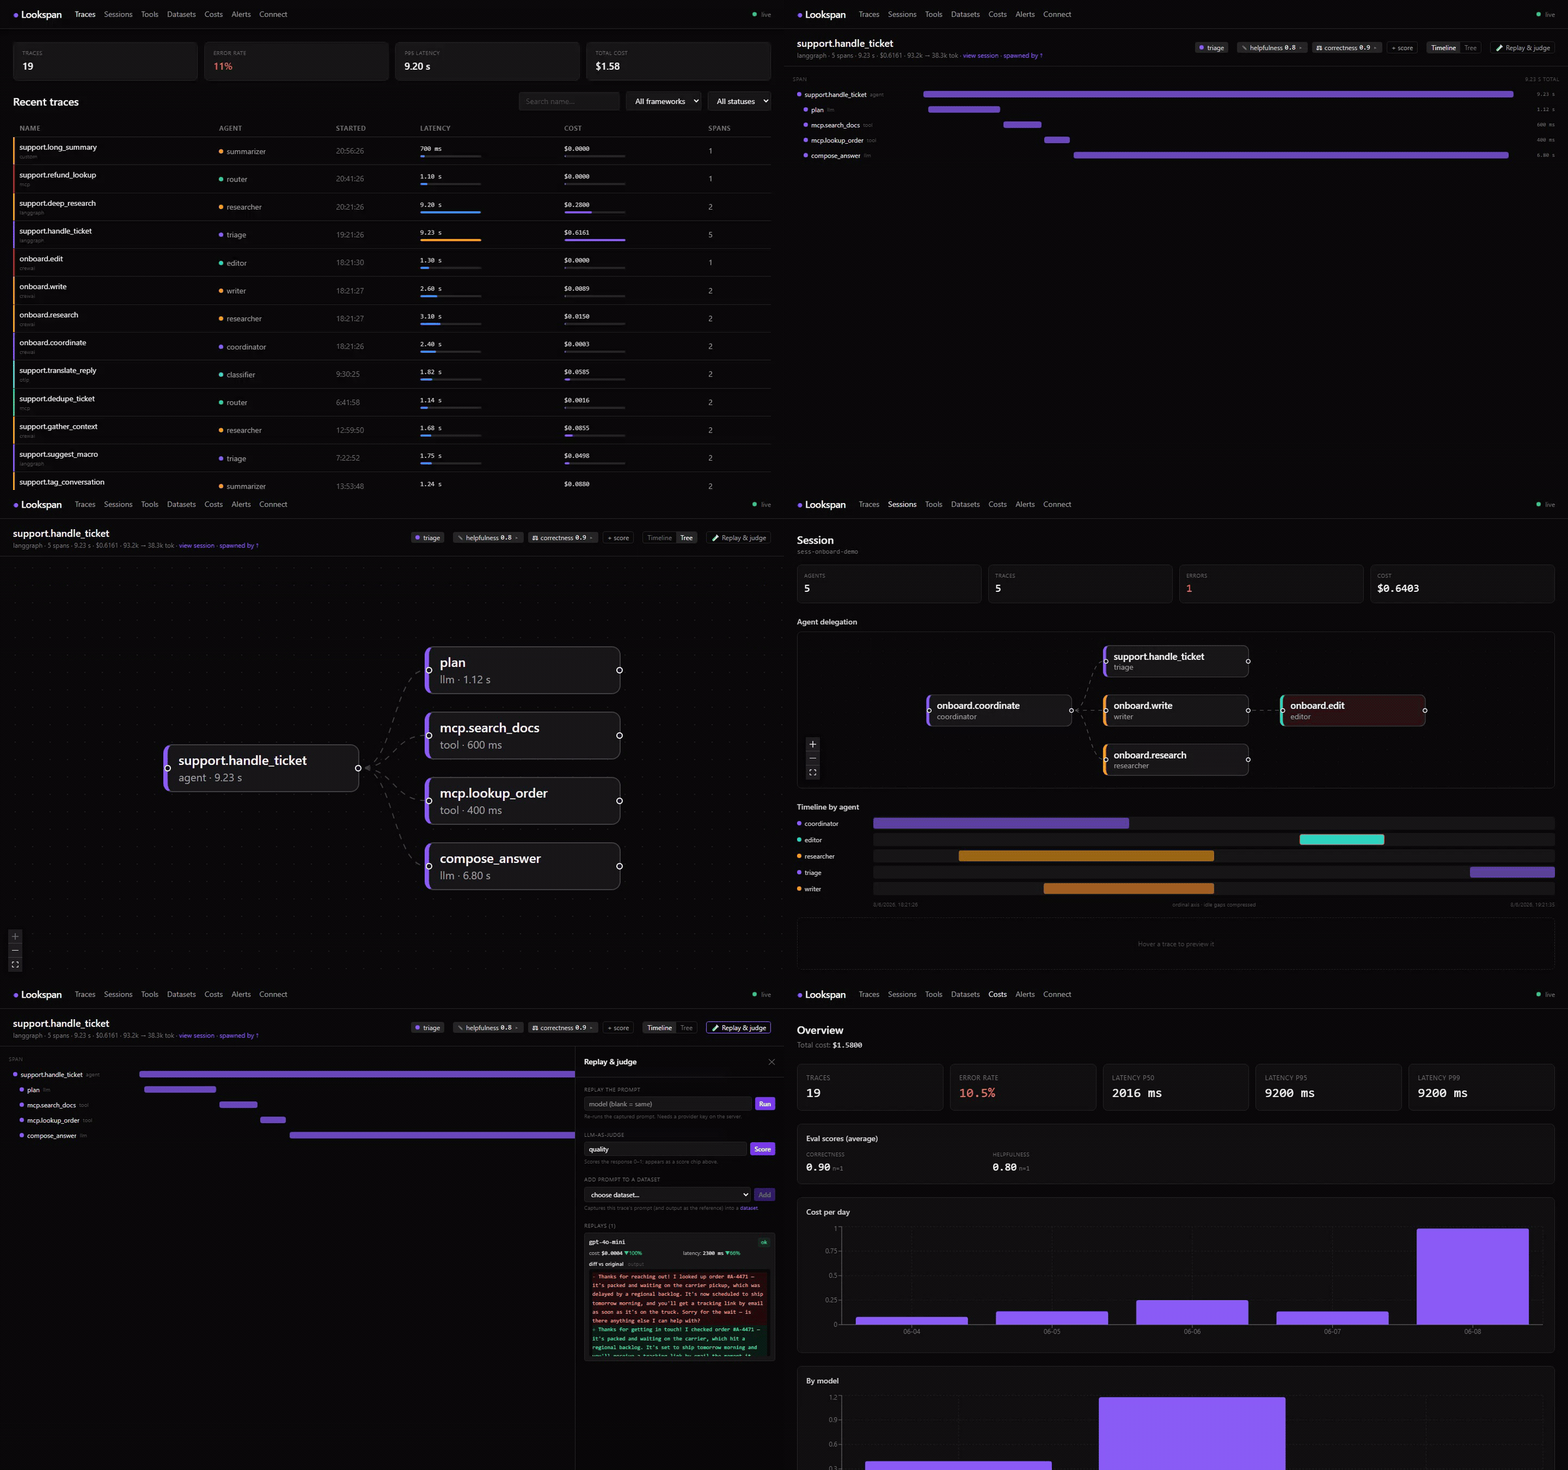
Agent (MCP · LangGraph · CrewAI · OpenTelemetry · HTTP) → POST /api/ingest → SQLite → real-time dashboard
🇪🇸 ¿Prefieres español? Lee el README en español.
⭐ If Lookspan saves you a debugging session, give it a star — it's the #1 way to help it grow. Got a use case, a bug, or a framework you'd like supported? Open an issue or say hi in Discussions.
The problem
When an AI agent misbehaves — fails, stalls, or quietly burns more tokens than expected — there's no native way to see what happened step by step. Existing observability tools are cloud-first: they want accounts, API keys, and shipping your production data to someone else's servers.
Lookspan takes the opposite approach: everything runs on your machine, data never leaves it, and infra cost is zero. Instrument your agent with an adapter (or just POST JSON) and open the dashboard in your browser.
Quick start
npx lookspan # → http://127.0.0.1:3100, no install, no cloud
Send your first span from any language:
curl -X POST http://127.0.0.1:3100/api/ingest \
  -H "Content-Type: application/json" \
  -d '{"spans":[{"traceId":"t1","spanId":"s1","parentSpanId":null,"type":"llm_call","name":"agent.run","startedAt":"2026-06-02T10:00:00Z","endedAt":"2026-06-02T10:00:01Z","status":"ok","framework":"custom","model":"gpt-4o","provider":"openai","usage":{"inputTokens":1000,"outputTokens":500,"costUsd":0}}]}'
Open http://127.0.0.1:3100 and watch the trace appear — with its cost computed server-side.
Open it like any other app
If you'd rather click an icon than type a command:
npm install -g lookspan
lookspan install-desktop          # bake in flags if you want: --port 3200 --retention 7d
That adds a Lookspan entry to your Desktop and Start Menu on Windows, to
~/Applications on macOS, and to your app menu on Linux — with the Lookspan
icon on Windows and Linux. Clicking it starts the server and opens the
dashboard. lookspan uninstall-desktop removes it.
It needs a real install — a shortcut into the
npxcache breaks the first time npm cleans it, soinstall-desktoprefuses to create one.
Features
- HTTP span ingest —
POST /api/ingestaccepts JSON batches of spans. Works with any agent that can make an HTTP request. - MCP-native — the
@lookspan/mcpTypeScript SDK wraps anyMcpClientand emits a span per MCP tool call, without changing your agent code. - Python SDKs —
lookspan(generic client) plus adapters for LangGraph/LangChain (lookspan-langgraph) and CrewAI (lookspan-crewai). - OpenTelemetry — an OTLP/HTTP receiver at
POST /v1/traces; point any OTel exporter at it with no Lookspan SDK.gen_ai.*attributes map to provider/model/tokens. - Real-time streaming — SSE endpoint
GET /api/streampushesspan.ingested,trace.updatedandalert.triggeredto the dashboard, no polling. - React dashboard — recent traces with a health strip + per-row latency/cost mini-bars; trace detail with a timeline (waterfall) or tree view and a conversation transcript of the prompt/response; replay diffs and A/B run comparison; costs & overview (error rate, latency p50/p95/p99, cost per day); alerts history.
- Cost tracking — aggregates input/output/cached/reasoning tokens and computes
cost_usdper span and per trace from a model pricing table, overridable with--pricing. - Export & audit — download the trace set as CSV (spreadsheet-friendly, UTF-8 BOM, formula-injection safe), JSON (metadata-only by default;
?raw=1to include attributes), or a self-contained printable HTML audit report (format=html) with provenance, summary cards and hand-drawn SVG charts.GET /api/export/traces?format=csv|json|html; honours the active framework/status/session filters. Every response carries provenance/integrity (X-Lookspan-Export-Sha256,-Count,-Truncated). - Alerts — get notified when a trace fails or exceeds a cost/token/duration threshold (toast + desktop notification + CLI + persisted history).
- Evaluation scores — attach metrics to a trace (
POST /api/traces/:id/scores) from an LLM judge, an assertion, or by hand. - Replay & LLM-as-judge — re-run a trace's captured prompt against the same or a different model and diff cost/latency/output, or have a judge model score the response 0–1. Needs a provider key (env, in-memory only).
- Datasets & experiments — collect prompts into a test set (seed from a trace or add by hand), run the whole set against a model in batch and score each output with the judge — aggregate cost/latency/score per run.
- Local SQLite (default) or external Postgres — versioned migrations. SQLite file at
~/.lookspan/lookspan.dbby default. Passing apostgres://…URL to--db/LOOKSPAN_DBconnects to that PostgreSQL server and persists data across restarts. See docs/CONFIGURATION.md → Postgres. Optional retention with--retention. - Security — binds to
127.0.0.1by default and only answers requests addressed to it (so a rebound domain gets nothing); non-loopback binds require--token; no cross-origin access unless you grant it with--cors-origin; server-side redaction of credential-looking attributes before storage. - One-line CLI —
npx lookspanstarts the server and the dashboard with no global install.
Integrating your agents
OpenAI SDK (drop-in)
Wrap your client in one line — every model call is traced (no OTel, no proxy):
npm install @lookspan/openai
import OpenAI from 'openai';
import { observeOpenAI } from '@lookspan/openai';

const openai = observeOpenAI(new OpenAI());
await openai.chat.completions.create({ model: 'gpt-4o', messages });
Anthropic SDK (drop-in)
npm install @lookspan/anthropic
import Anthropic from '@anthropic-ai/sdk';
import { observeAnthropic } from '@lookspan/anthropic';

const anthropic = observeAnthropic(new Anthropic());
await anthropic.messages.create({ model: 'claude-sonnet-4-6', max_tokens: 1024, messages });
TypeScript / MCP
npm install @lookspan/mcp
import { wrapMcpClient, HttpSpanExporter } from '@lookspan/mcp';

const exporter = new HttpSpanExporter({ endpoint: 'http://127.0.0.1:3100/api/ingest' });
const { client } = wrapMcpClient(mcpClient, { exporter, agentId: 'my-agent' });

// Use it exactly as before — every callTool emits a tool_call span.
await client.callTool({ name: 'read_file', arguments: { path: '/tmp/foo.txt' } });
await exporter.flush();
Python (generic, LangGraph, CrewAI)
pip install lookspan # + lookspan-langgraph / lookspan-crewai
from lookspan import LookspanClient
from lookspan_langgraph import LookspanCallbackHandler

client = LookspanClient(endpoint="http://127.0.0.1:3100/api/ingest")
handler = LookspanCallbackHandler(client=client, agent_id="my-agent")

result = graph.invoke({"messages": []}, config={"callbacks": [handler]})
client.flush()
OpenTelemetry (no SDK)
Point any OTel exporter at the standard OTLP endpoint:
export OTEL_EXPORTER_OTLP_TRACES_ENDPOINT=http://127.0.0.1:3100/v1/traces
# protobuf (the OTel default) and JSON are both accepted
More runnable examples in examples/.
Evaluate & replay
The drop-in SDKs can capture each call's prompt and reply (captureContent, off
by default; secrets are scrubbed server-side). With that, Lookspan can close the
loop from observe to improve — open a trace and use the Replay & judge
panel, or call the API directly:
# Provider keys live in memory only — never written to the DB or logged.
LOOKSPAN_OPENAI_API_KEY=sk-... npx lookspan
#   ...or LOOKSPAN_ANTHROPIC_API_KEY / --openai-key / --anthropic-key

# Replay the captured prompt against another model and diff cost/latency/output
curl -X POST localhost:3100/api/traces/<id>/replay -H 'content-type: application/json' \
  -d '{"model":"gpt-4o-mini"}'   # omit "model" to re-run the original

# Score the response 0–1 with an LLM judge (stored as an "llm-judge" score)
curl -X POST localhost:3100/api/traces/<id>/judge -H 'content-type: application/json' \
  -d '{"metric":"correctness"}'
To enable replay/judge, explicitly pass { captureContent: true } to
observeOpenAI / observeAnthropic only when prompts/outputs are safe to persist.
Datasets & experiments
Scale evaluation from one trace to a whole test set. Build a dataset (seed items from real traces or add them by hand), then run it against a model — each item is replayed and, optionally, scored by the judge, with aggregate cost/latency/score per run. Manage it all under Datasets in the dashboard, or:
# Create a dataset and add the captured prompt of a trace as an item
DS=$(curl -s -X POST localhost:3100/api/datasets -d '{"name":"regressions"}' -H 'content-type: application/json' | jq -r .dataset.id)
curl -X POST localhost:3100/api/datasets/$DS/items/from-trace -H 'content-type: application/json' -d '{"traceId":"<id>"}'

# Run the whole set against a model, judging each output
curl -X POST localhost:3100/api/datasets/$DS/run -H 'content-type: application/json' \
  -d '{"model":"gpt-4o-mini","judge":true,"metric":"correctness"}'
HTTP API
| Method | Path | Description |
|---|---|---|
GET |
/api/health |
Service status |
POST |
/api/ingest |
Ingest spans (body: IngestPayload) |
GET |
/api/traces |
List traces (paginated; filter by framework, status, sessionId) |
GET |
/api/traces/:id |
Trace detail with all its spans and scores |
GET |
/api/export/traces |
Download traces as a file (format=csv|json|html; raw=1 un-redacts JSON; same framework/status/sessionId/limit filters) |
POST |
/api/traces/:id/scores |
Attach an evaluation score ({name, value, comment?, source?}) |
POST |
/api/traces/:id/replay |
Re-run the captured prompt ({model?, provider?, spanId?}); needs a provider key |
GET |
/api/traces/:id/replays |
List past replays for the trace |
POST |
/api/traces/:id/judge |
LLM-as-judge: score the prompt/response ({metric?, model?, provider?, rubric?}) |
GET POST |
/api/datasets |
List / create datasets |
GET |
/api/datasets/:id |
Dataset detail (items + runs) |
POST |
/api/datasets/:id/items |
Add item(s) ({input, expected?} or {items:[…]}) |
POST |
/api/datasets/:id/items/from-trace |
Seed an item from a trace's captured prompt |
POST |
/api/datasets/:id/run |
Run the set against a model ({model, judge?, metric?}); needs a provider key |
GET |
/api/runs/:id |
Run summary + per-item results |
GET |
/api/sessions |
List sessions (agents, traces, cost, errors, time range) |
GET |
/api/sessions/:id |
Session summary + its traces (multi-agent timeline) |
GET |
/api/costs/summary |
Cost breakdown (total, by model, provider, agent) |
GET |
/api/stats |
Stats summary (totals, error rate, latency p50/p95/p99, cost per day) |
GET |
/api/alerts |
History of triggered alerts |
GET |
/api/stream |
Real-time SSE event stream |
POST |
/v1/traces |
OpenTelemetry OTLP/HTTP trace receiver (JSON ExportTraceServiceRequest) |
CLI options
npx lookspan [options]

Commands:
  install-desktop [options]  Add a one-click desktop launcher (options are baked in)
  uninstall-desktop          Remove it again

Options:
  -p, --port <port>        Port to listen on            (default: 3100)
      --host <host>        Host to bind to              (default: 127.0.0.1)
      --db <path|url>      SQLite path or postgres:// URL (default: ~/.lookspan/lookspan.db)
      --retention <dur>    Prune traces older than e.g. 7d, 24h, 30m
      --token <token>      Require Authorization: Bearer <token> on the API
      --pricing <file>     Custom model pricing table (JSON)
      --alert-error                Alert when a trace fails
      --alert-cost <usd>           Alert when a trace costs more than <usd>
      --alert-tokens <n>           Alert when a trace exceeds <n> tokens
      --alert-duration <ms>        Alert when a trace takes longer than <ms>
      --open               Open the dashboard in your browser
  -h, --help               Show help
  -v, --version            Show version
Every flag has a LOOKSPAN_* environment-variable equivalent (LOOKSPAN_PORT, LOOKSPAN_TOKEN, LOOKSPAN_PRICING, LOOKSPAN_ALERT_*, …). Replay & LLM-as-judge read LOOKSPAN_OPENAI_API_KEY / LOOKSPAN_ANTHROPIC_API_KEY (or --openai-key / --anthropic-key); these stay in memory and are never persisted.
See docs/CONFIGURATION.md for the complete flag + environment-variable reference, defaults, and examples.
How it compares
| Lookspan | Langfuse | Phoenix (Arize) | |
|---|---|---|---|
| Startup | npx lookspan (zero infra) |
Docker + Postgres + ClickHouse | pip install (Python) |
| Storage | local SQLite | Postgres + ClickHouse | local / in-memory |
| Focus | TS/JS + MCP stack | full platform (evals, prompts) | evals / RAG (Python) |
| Your data | stays local by default; external Postgres optional | self-host or cloud | local or cloud |
| OpenTelemetry | native OTLP receiver | yes | yes (OTel-native) |
| Eval loop | replay-vs-model diff, LLM-as-judge & datasets built in | evals + datasets | evals / experiments |
Lookspan isn't trying to be a full platform. It bets on being the zero-setup observability layer for the TypeScript/MCP agent stack, with the best first-five-minutes experience. See the ROADMAP.
Security
Lookspan binds to 127.0.0.1 (loopback) and requires no auth by default — right
for local use. If you expose it (--host 0.0.0.0), protect it with a token:
LOOKSPAN_TOKEN=my-token npx lookspan --host 0.0.0.0
# /api/* and /v1/* then require Authorization: Bearer my-token (/api/health is exempt).
The collector also redacts before persisting, so telemetry does not drag secrets into the database:
- values of credential-looking keys (
authorization,api_key,token,secret,password,cookie…) ininputandattributes; - secret-looking values wherever they appear — including in
output— for provider keys, GitHub and Slack tokens, AWS access key ids and JWTs, so a key pasted into a prompt is caught even under an innocent key name.
The scan walks twelve levels deep, which covers the nesting real agent payloads reach (an OpenAI tool call puts its arguments six levels down). Anything deeper is replaced wholesale rather than stored unscanned: if the scan cannot prove a subtree is clean, it does not keep it.
Development
This is an npm-workspaces monorepo. packages/ holds internal libraries, apps/
the dashboard, python/ the standalone Python SDKs.
git clone https://github.com/JoniMartin27/lookspan.git
cd lookspan
npm install
npm run dev        # API on :3100, dashboard with hot-reload on :5173
npm run ci         # typecheck + lint + test + build + smoke-test the published bundle
The Python SDKs are separate packages with their own test suites (CI runs all three):
cd python/lookspan-core && pip install pytest . && pytest -q
lookspan-crewai installs with --no-deps for tests — CrewAI itself is only
imported inside attach(), so the span-building paths are covered with stand-in
events instead of a heavy dependency tree.
Contributions welcome — see .github/CONTRIBUTING.md. Release process in docs/PUBLISHING.md. Security policy: SECURITY.md.
License
MIT — Copyright (c) 2026 Jonathan Martin. See LICENSE.
Lookspan is part of Fervon, the studio behind a portfolio of open-source developer tools (Trace, InferBench, ClaudeScope, Launchpad and more). The Fervon forge identity — carbon surfaces, ember/amber accents — is applied across the landing, the dashboard and the docs site.

No comments yet
Be the first to share your take.