
A lightweight statusline monitor for Claude Code that displays rate-limit usage, reset timers, model info, context window, and prompt-cache age. It supports multiple display styles and themes, integrates with AgentParty workflows, and can run as a fast daemon to minimize CPU overhead.
Lightweight Claude Code statusLine: 5h/7d rate-limit usage, reset countdowns, model + context window, prompt-cache age — one line, 3 styles × 9 themes, daemon fast-mode
355Stars
22Forks
0Open issues
3Watching
Python MIT v3.35.0 Updated 1 week ago
At a glance
Python Actively maintained Commercial OK
README
Claude Status Bar
Your Claude Code usage, at a glance. 5h / 7d rate-limit bars, reset countdowns, model, context window, and prompt-cache freshness — inline in Claude Code's status line, or a floating HUD on the desktop app.





English · 简体中文 · Install · Documentation
[!IMPORTANT] macOS standalone users should upgrade to v3.32.5 now. Older onefile releases could leave a new ~11 MB PyInstaller
_MEI*runtime directory on every one-second refresh that was killed during startup. Re-running the installer switches to an onedir bundle and safely removes inactive leftovers:curl -fsSL https://raw.githubusercontent.com/leeguooooo/claude-code-usage-bar/main/install.sh | bash
Claude Code tells you almost nothing about where you stand against your rate limits.
claude-statusbar puts the numbers that matter on one quiet line at the bottom of your
terminal — so you never switch context to a separate window to answer "how much have I
got left, and when does it reset?"
Features
- Official 5h / 7d usage — the same rate-limit numbers Claude Code enforces, with reset countdowns and end-of-window projections (
→NN%), not a local guess. - Model & context window — current model and how full the context is (
Opus 4.8 · 350k/1M). - Prompt-cache countdown — see how long your cache stays warm (
cache 4m23s) so you know when the next turn pays full price. - Cost & balance — optional per-session cost, or live relay/API balance in no-quota setups.
- Two surfaces — inline
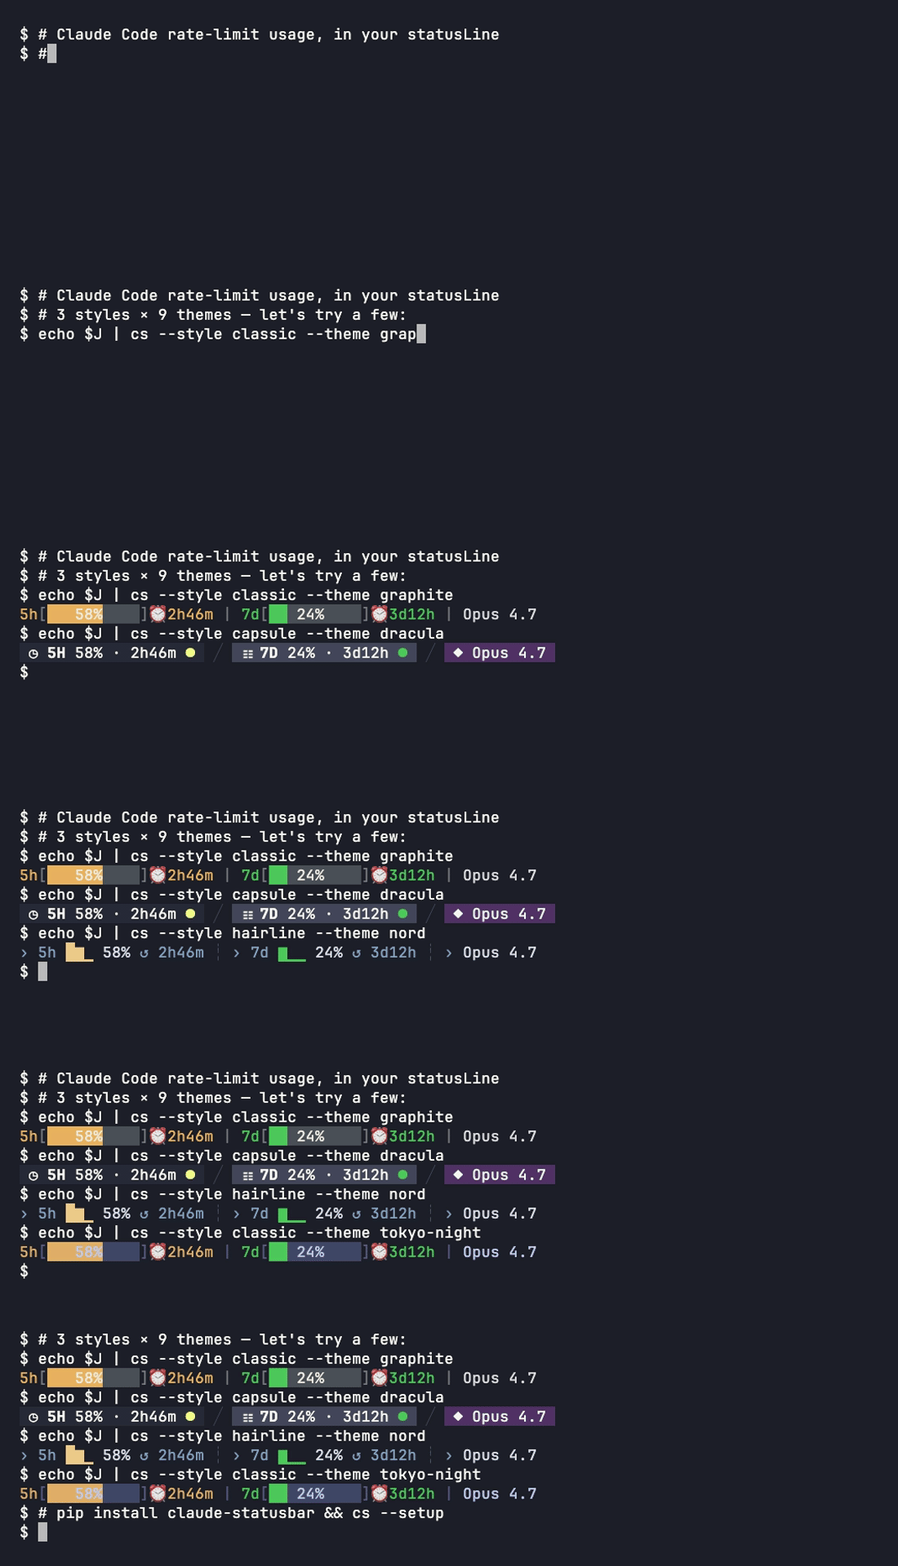
statusLinein the terminal, or an always-on-top floating HUD for the Claude desktop app (macOS). - 3 styles × 9 themes — switch the whole look with one command: battery-bar, capsule, or hairline.
- Fast by design — an optional daemon renders in well under 1% CPU even at a 1-second refresh.
- More when you want it — git branch & diff stats, session activity, AgentParty/Codex presence, IELTS writing-coach progress — each opt-in.
- Zero-dependency install — a single prebuilt binary (no Python needed) or a
pippackage. Auto-updates.
Install
Claude Code (terminal)
One line — no Python, no pip. Downloads a prebuilt standalone binary for your platform (macOS Apple Silicon, Linux x86_64) and wires up the status line:
curl -fsSL https://raw.githubusercontent.com/leeguooooo/claude-code-usage-bar/main/install.sh | bash
Security-conscious? Download and read it first — the header lists exactly what it touches. On platforms without a prebuilt binary it falls back to pip.
On macOS this one line does everything — it wires the terminal statusLine and, if the
Claude desktop app is installed, registers the floating desktop HUD to auto-start on login. The
macOS binary bundles the HUD, so there's no separate pip install '[hud]' and no extra config.
Prefer pip / uv, or want the desktop HUD extra? Install the Python package:
pip install claude-statusbar     # or: uv tool install / pipx install
cs --setup                       # wires the statusLine hook + installs the skill
Restart Claude Code and the bar appears at the bottom. Other paths (skill-only, plugin marketplace, Codex/AgentParty bridge) are in the install guide.
Deep dive: Is that
cache 4m23sline actually accurate? — how the prompt-cache countdown is computed
Claude desktop app (macOS) — cs hud
The desktop app has no status line, so cs hud adds an always-on-top floating panel with the
same official 5h / 7d usage (sampled by the desktop app itself, not an estimate) and your
active AgentParty channels.
If you used the curl … install.sh | bash one-liner above, the HUD is already installed —
the macOS binary bundles it and the installer auto-registers it when the desktop app is present.
The commands below are only for a manual/pip setup:
pip install 'claude-statusbar[hud]'   # adds PyObjC (macOS GUI deps)
cs hud install                        # launchd: auto-start on login + keep-alive
Collapsed pill → click to expand → drag anywhere; it hides when the desktop app isn't open. Full details in the Desktop HUD guide.
What it shows
The default bar — classic style, graphite theme:

At a full refresh it can render up to three lines, each segment optional:
| Line | Segments |
|---|---|
| Usage | 5h / 7d rate-limit bars, reset countdowns, end-of-window projections (→NN%), model & context window, prompt-cache countdown, optional session cost or relay balance |
| Project | git worktree marker (⧉ name (3) with the repo's worktree total, its own hue, leads the line), project name, git branch, session +/− lines, duration, version |
| Mode | session effort / thinking / fast / style |
Every icon, color threshold, and toggle is documented in the segment reference. Nine themes and three styles are in styles & themes.
Documentation
| Guide | What's inside |
|---|---|
| Install | Binary, PyPI, one-shot installer, skill-only, plugin, Codex bridge |
| What it shows | Full per-segment reference table |
| Styles & themes | 3 styles × 9 themes, previews, slash commands |
| Configuration | Config file, all show_* keys, env vars, JSON output, CLI cheatsheet |
Desktop HUD (cs hud) |
macOS floating panel for the Claude desktop app |
| Fast mode (daemon) | Sub-1% CPU daemon, launchd / systemd auto-start |
| No-quota mode | Relay / Bedrock / Vertex layout, context battery, balance |
| AgentParty / Codex bridge | Local workspace-presence line |
| Cache countdown | Data source + how cache 4m23s is computed |
| Troubleshooting | cs doctor, common problems, upgrading |
Comparison
There are a few good Claude Code usage monitors. They solve overlapping but distinct problems — pick the one that matches where you want the information.
| Tool | Lives in | Optimized for |
|---|---|---|
claude-statusbar (cs) |
Claude Code's statusLine (one line at the bottom) |
Glanceable while you work; zero context-switching |
| ccusage | Standalone TUI in a separate terminal window | Long-form usage analytics, cost breakdowns over weeks |
| Claude Code Usage Monitor | Standalone TUI with predictive burn-rate | Real-time burn-rate forecast for paid plans |
cs is intentionally one line of color and one decision per second. If you want a dashboard
with charts, daily/weekly aggregates, and burn-rate prediction, run a TUI in a side pane. The
two coexist nicely.
Integrations
prompt-language-coach — install the
plugin to track IELTS band progress. The bar then shows your writing level and trend
automatically (no config; appears when ~/.claude/language-progress.json exists):
... | Opus 4.8(350k/1M) | EN:6.0↑ JA:5.0→
↑ improved · ↓ dropped · → no change since last session.
Contributing
PRs welcome. The full contributor guide — local setup, test commands, architecture map, coding conventions, release flow — is in CONTRIBUTING.md. Security issues: SECURITY.md.
git clone https://github.com/leeguooooo/claude-code-usage-bar
cd claude-code-usage-bar
uv sync
PYTHONPATH=src uv run pytest tests/   # 900+ tests, ~3s
The render path is hot (up to 60×/min at refreshInterval: 1) — tests/test_import_perf.py
pins which modules can't be imported on the fast path. Read CONTRIBUTING.md before adding
dependencies.
Every version's changes: CHANGELOG.md · GitHub Releases.
Acknowledgments
- @marcwimmer — original
show_cache_agewidget (#9) - claude-monitor — token-usage analysis library used as the optional fast-path data source
Star history
Static snapshot taken at v3.3.x; click for the live chart.
Comments (0)
Sign in to join the discussion.
No comments yet
Be the first to share your take.